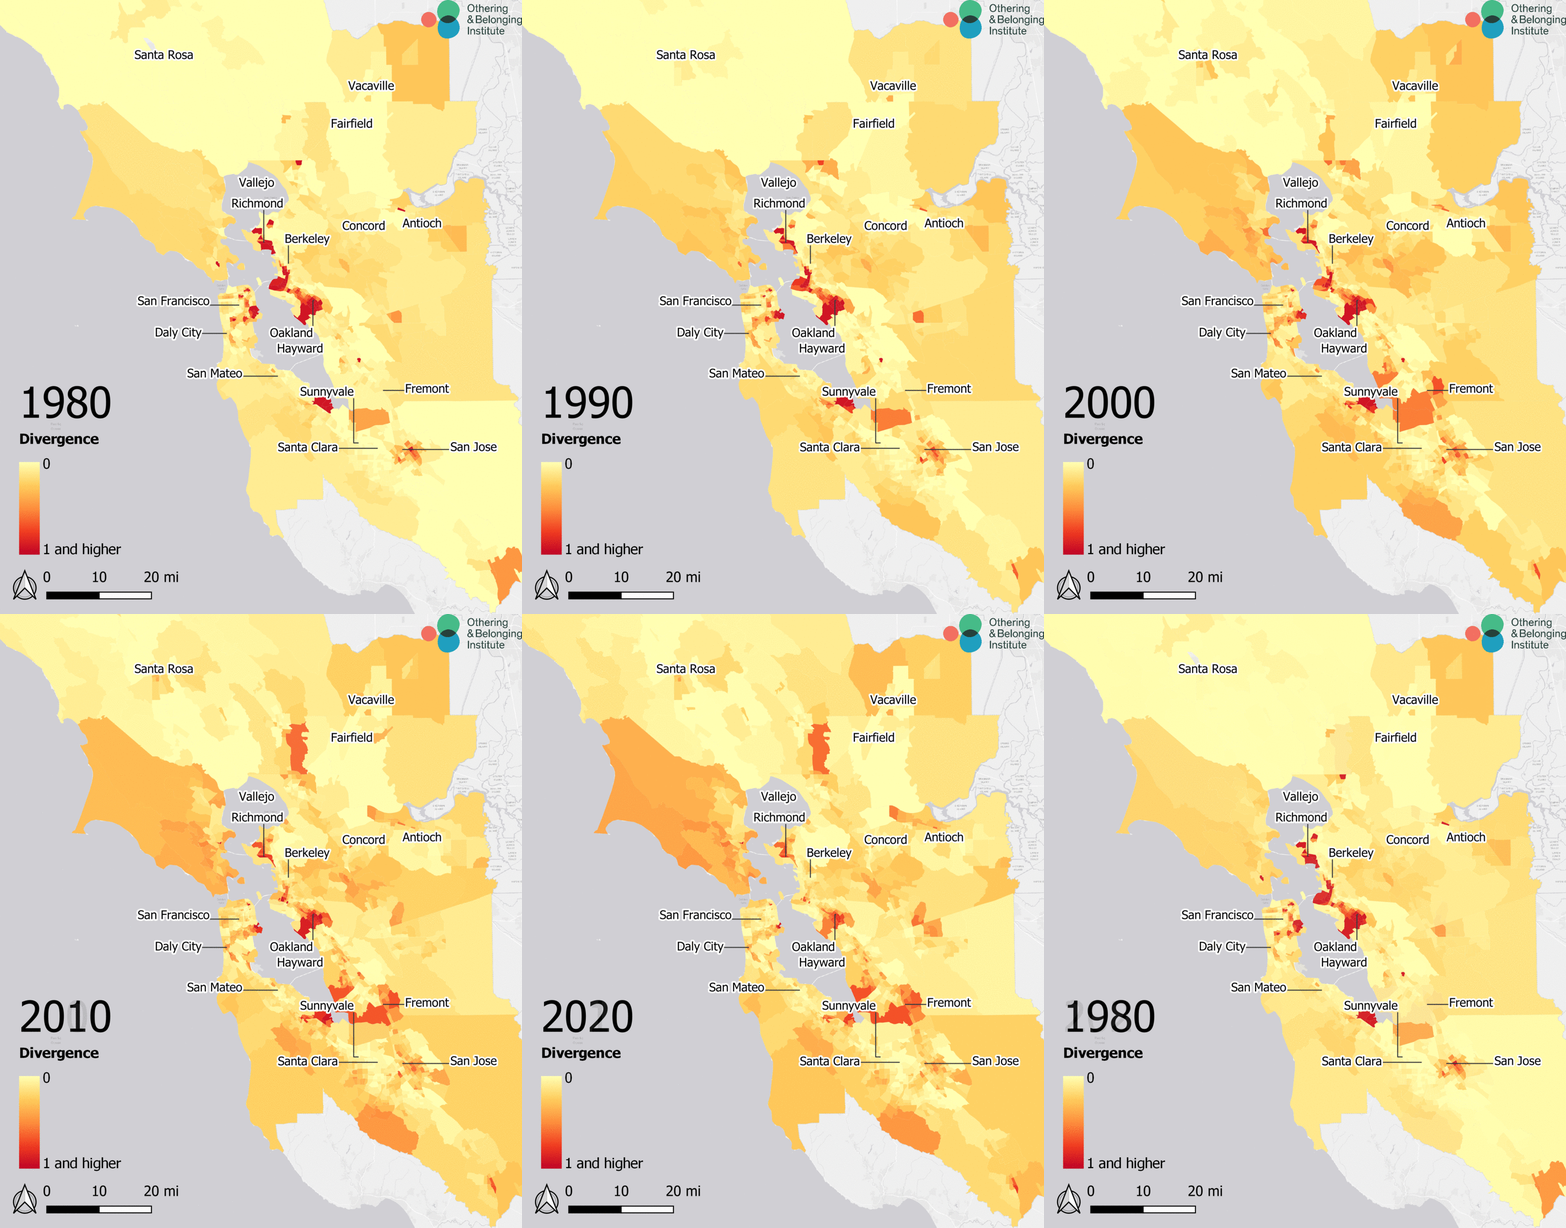
Racial Segregation in the Bay Area
- Jonathan Osler
- Oct 12, 2021
- 1 min read
These powerful resources come from the Othering & Belonging Institute's Roots of Structural Racism project
In The Classroom
Questions and content to explore with students might include:
What is "median household income"? Why is the median used instead of a different type of averaging?
What does "inter-municipal divergence" mean? How did the authors calculate those values? Why are they all below 1? Why sort these values from largest to smallest?
Can a city that is highly diverse also be segregated? How? Why?
Compare the median HHI with different racial compositions by city. How strong do these racial groups correlated with the HHI?
What is the relationship, if any, between the percent of a city that is white (or another race) to it's ranking in this list?
Choose some of this data to represent in graph form. What are the key takeaways from your graph?
How Would You Use This News?
How would you use this graph in your classroom? What math content could it help students explore? Share your ideas in the comments.
.jpg)


This is an interesting and important math problem to discuss in a classroom, but I ran into a couple obstacles that would make teaching this difficult: firstly that HHI is never defined, and the expectation is that every reader will instinctively know what that is; this creates a language barrier for anyone who struggles with language and literacy. Secondly, you ask what the definition of Inter Municipal Divergence is, and how it is calculated, but after reading the linked article/study I couldn't find that calculation anywhere. Perhaps the answers seem straightforward to you, but they are not to everyone.
Very interesting data but confusing as to how you got calculations. I would love to share this with high school students but there doesn't seem to be any explanation for how you calculated "inter-municipal divergence".
This is fascinating that there is such a great wealth gap between locations within the Bay Area, and how diversity is and is not an affect of the gap
Hey RadicalMath, great graph and topic and guiding questions! My classmate and I had a great time diving in and off of the titled topic. We were really interested in what correlations you found between race majority and medium income? We also wondered how employment rates between different racial groups my reflect or not the median income. We continued in the discussion that historically cities are both diverse and segregated as populations gather where there is similarity in culture, language, interests, etc. and that segregation isn't necessarily negative unless it takes away from another's opportunity and livelihood. We were a little confused on the use of divergence in the changing heat map, but enjoyed the conversation that stemmed from this…